
The maximum pain theory is the idea that stocks with robust options trading tend to gravitate towards the option strike price that will create the most losses for long option holders at expiration. There is some debate as to whether this tendency is a natural market movement as contracts are closed prior to expiration, a result of market manipulation from market makers to maximize their gains, or even if there is a true tendency at all. Regardless of the causation and how accurate the theory is, there is a good opportunity to take short term gains trading the last week before expiration, if you can isolate stocks that ten to trade in this fashion.
The strategy we use calls for trading options, has worked well for us in the past, and we expect this method to continue generating quick profits for us in the future. This strategy will use butterfly spreads to make money in the last week before options expiration. The downside to this particular strategy is that we can only use it one particular time of each month. We’ll trade the last week of trading before options expiration, which occurs on the third Friday of each month. We’ll utilize the concept of, “stock pinning” (sometimes called “pinning the strike” or “options pain”) to make profits using a low risk option trading strategy. As always, no option trading method is foolproof and any strategy will generate some losses. Please, make sure to your own due diligence before utilizing this strategy.
What is Stock Pinning?
 The phenomenon of pinning is that when a stock has heavy options trading activity, the price of the stock will gravitate towards the strike price that has the most open interest at expiration. Having high levels of open interest (or existing options contracts) is one of the key factors to it. The conspiracy theorists will say that this works because the market makers are manipulating the market to take as much money from as many investors as possible. However, the reality is that stock pinning is a result of dynamic hedging by institutional traders, including market makers, floor traders, hedge funds, and others seeking delta-neutral trades.
Why Use Butterfly Spreads?
We’re going to use the options strategy of butterfly spreads because it can make you money if you accurately predict the closing stock price on options expiration day. However, if you are wrong on where the stock closes on the 3rd Friday of the month, this strategy will limit your losses…even if you’re REALLY wrong. As options strategies go, butterflies fall into the category of conservative options trading.
How Can I Make Money With This?
A real world example of this occurred on the June 18, 2010 expiration of Google options. Google had the most open interest (i.e. maximum option pain) in the $500 strike price contracts. On June 11th, the Friday before expiration Friday, the stock traded between $481 and $488. We placed our trades while the stock was trading around $485. We established our butterfly spread buying 10 Calls with a strike of $490 for $3.93 per contract, selling 20 calls with a strike of of $500 capturing $1.32 per contract, and buying 10 calls with a strike of $510 for $0.35 per contract.
Ultimately, GOOG closed on expiration day at $500.03, just $.03 away from a perfect pin. This trade netted us a nice profit of $8,570 (less $32.50 in commissions) in just one week…while risking maximum potential losses of only $1,640.
You Too Can Make Money With This Options Trading Strategy
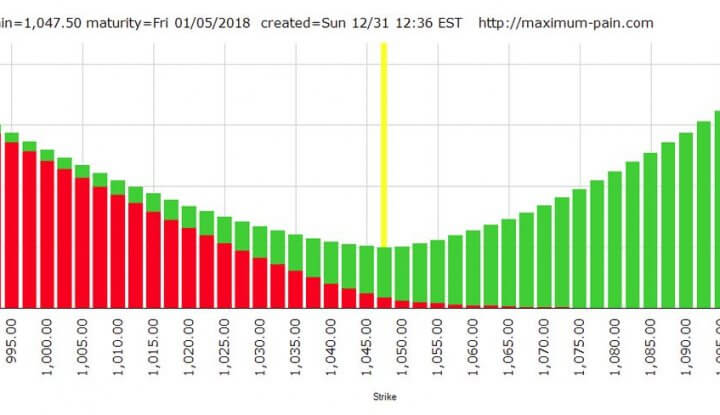
It’s actually quite simple. In order to take advantage of this strategy, you’ll need a maximum option pain calculator, which you can get here for free: //maximum-pain.com/options/max-pain/
You’ll also need an options trading account. Most online brokers today have robust options trading platforms, so all you need to do is request options trading approval for your existing account. If for some reason your broker doesn’t offer this, we love Etrade’s options platform, ever since they bought Options House a few years ago.
Finally, you need to learn about the butterfly spread strategy. We have a page explaining the strategy here: Butterfly Spread Trading
Executing the Strategy
In order to isolate strong potential trades, you need to look for stocks with high levels of open interest and trading volume. It’s also good to find ones with high levels of implied volatility, but this isn’t as important as open interest and volume. On the Friday of the week before options expiration, which is always the 3rd Friday of the month, run those stocks through your option pain calculator, and compare the maximum pain price to the current stock price in the market.
Once you’ve done that, decide which of the stocks you believe are most likely to gravitate towards the pain price. We like to make sure there won’t be any earning announcements, or other major news expected during the next week. This strategy works best under normal trading conditions, so news (especially big news) is very likely to turn the trade into a loser. On the 2nd Friday of the month, place your butterfly spread with the two contracts that you are selling be the same strike as the max pain strike. Then wait the next week until expiration. If you have any premium on the long contracts, you should sell those at some point on expiration day, unless you want to exercise them and buy the stock. That’s all there is to it!
**Note: To be successful with any options trading strategy, it’s important that you understand the Black-Scholes pricing model and how implied volatility affects options prices.
Suggested Further Reading:
“Trading Options at Expiration: Strategies and Models for Winning the Endgame” – by Jeff Augen
Equity and index options expire on the third Friday of each month. As that moment approaches, unusual market forces create option price distortions, rarely understood by most investors. These distortions give rise to outstanding trading opportunities with enormous profit potential.
Available on Amazon

