A Basic Introduction to Shorting Stocks
Stock shorting is a trading strategy used by investors who believe that the value of a company’s stock is going…

Stock shorting is a trading strategy used by investors who believe that the value of a company’s stock is going…
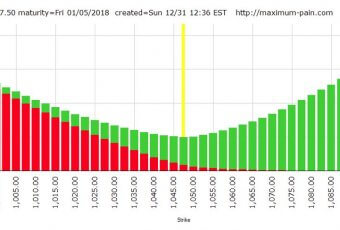
The maximum pain theory is the idea that stocks with robust options trading tend to gravitate towards the option strike…

Currency trading can be very lucrative, but also very risky if you’re inexperienced. Many newcomers have tried to get in…

This article was originally published on the Foundation for Economic Education’s website, FEE.org and was written by Kurt W. Rotthoff,…

**This article is reprinted from The Mises Institute. The original article can be found here: mises.org/wire/austrian-economics-can-help-investors-look-beyond-short-term-thinking Austrian Economics Can…
Currency trading can be very lucrative, but also very risky if you’re inexperienced. Many newcomers have tried to get in…

This article was originally published by The Mises Institute in The Free Market Special Issue in April of 1984. The…


